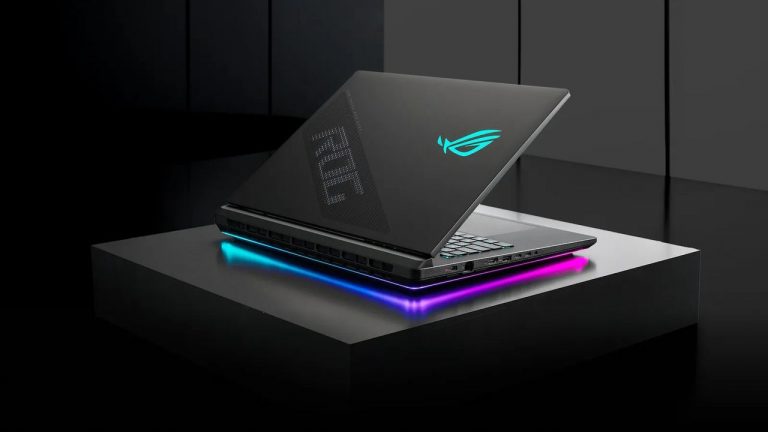
I do love a good puzzle. There’s something real satisfying about looking at the benchmark results and specs of two different laptops and coming to a crisp, neat conclusion on why one, that’s so similar on paper, performs so differently to another. That’s great and all, but the fact that that fact is even a thing is a problem. The fact that we’re talking about that fact here right now, as a thing, with Acer’s latest Predator Helios Neo is a problem. And it shouldn’t be.
Because you should be able to look at any laptop, see a GPU name, and know what performance you’re getting, straight away. It shouldn’t be ambiguous. You shouldn’t have to dive into reviews, and you shouldn’t need to go hunting around in the murky deep waters of spec manuals, trying to find out exactly if this new RTX 5080 is only as good as an RTX 5060, or secretly an RTX 5090 pretending to be an RTX 5070. And yet here we are. Same problem. Different day. But interestingly, it’s not just the wattage caps that are entirely the bloody issue for once (like they almost always are). And I’ll get to that frustrating stuff, but first, let’s talk up the good stuff, shall we? Because there’s a lot to like here.
This is Acer’s latest Helios Neo 16S AI. It’s not actually available yet, properly, so pricing is slim on the ground (and of course there are also 23 different specs per region with slightly different memory and SSD setups), but it’s been revamped specifically for this year, and announced admittedly (I’m a slow reviewer) in May. And it’s stunning.
Helios NEO 16S AI
Model No
PHN16S-i71-936M
CPU
Intel Core Ultra 9 290HX Plus
GPU
Nvidia RTX 5080 115W
RAM
32GB DDR5-6400
Storage
2x 1TB Kingston OM8PJP41024K3-CA0 PCIe 4.0 SSDs
Screen Size
16-inch OLED
Refresh Rate
240 Hz
Resolution
2560×1600
Battery
92 Whr
Dimensions
19.9 x 356.8 x 275.5mm | 0.78 x 14.05 x 10.85 inches
Weight
2.3 kg | 5.07 lbs
Price
$3,299 | UK pricing TBC
Buy if…
✅ You want the best screen on a gaming laptop, wrapped in something that’s actually portable: This is a high-end, full-size desktop monitor spec, strapped to a chassis that you can shove in a backpack. A beautiful inky display that’s vibrant, high refresh, and stupid quick on response.
Don’t buy if..
❌ You want to pay RTX 5080 money for RTX 5080 performance: At 115 W, with a cooling solution that folds under CPU-heavy titles, this is RTX 5070-class performance dressed up in a tux, and not the cute open-source penguin kind.
You’ve got a beautiful, crisp glossy OLED display, surrounded by a super-thin bezel, pumping out a 240 Hz refresh rate across a 2560×1600 res, with a VESA-certified DisplayHDR True Black 500 rating. It’s situated on top of a ridiculously thin chassis body (20mm deep), with clean, sharp edges, and a finish that, although not super premium on feel, looks great. With a delicate, sensitive touchpad and a simple yet efficient RGB keyboard.
There’s buckets of connectivity here too, including three USB Type A, two USB Type C, HDMI, drop-jaw ethernet, Micro-SD card reader, and somehow (I do suspect I know how) Acer’s also crammed in 92 Whrs of battery into this thing, in assumedly the same manner that I’ve managed to stuff 32,673 unread PR messages into my email archive in the last year (yes Intel I’ll give you your Core i7 6700K back when I’m good and ready thankyou).
This is the bit where I crack my knuckles, put on my reviewer’s cap (jokes on you, it’s flat and it’s always on), and tell you what the hell is going on in terms of performance, because on paper the Helios NEO looks incredible. There’s 32GB of DDR5 running at a sumptuous 6400 MT/s, Intel’s latest Core Ultra 9 290HX Plus (with a staggering 24 cores), and an RTX 5080 16GB GPU, backed up with a 115 W TGP limit. Yowzer. All tied to that gorgeous OLED display too.
FutureFutureFutureFuture
You’ve got all of that power ready to go. So the performance is good, right? It’s good, right? Errr, well, I mean, you get some. It’s there. Side-by-side, compared to Lenovo’s Legion 9i Gen 10, it’s kind of average, kinda bad. Even compared to the Nitro V 16 AI I reviewed earlier in the year (the one with a 95W RTX 5070), it barely hits numbers higher than that can muster. At least in-game, which is problematic as that RTX 5070 machine is about two grand cheaper.
1080p gaming performance
Testing the 1080p gaming performance of gaming laptops
Cyberpunk 2077 (1080p RT Ultra)Baldur’s Gate 3 (1080p Ultra)Black Myth: Wukong benchmarking tool (1080p High)F1 24 (1080p Ultra High)Metro Exodus Enhanced Edition (1080p Ultra)
Acer Predator Helios NEO 16S AI | RTX 5080 115 W
Acer Nitro V16 | RTX 5070 95 W
Lenovo Legion 7i Pro Gen10 | RTX 5080 175 W
Lenovo Legion 9i Gen 10 | RTX 5080 175 W
Cyberpunk 2077 (1080p RT Ultra) DataProductValueAcer Predator Helios NEO 16S AI | RTX 5080 115 W48 Avg FPS, 29 1% Low FPSAcer Nitro V16 | RTX 5070 95 W39 Avg FPS, 24 1% Low FPSLenovo Legion 7i Pro Gen10 | RTX 5080 175 W68 Avg FPS, 38 1% Low FPSLenovo Legion 9i Gen 10 | RTX 5080 175 W68 Avg FPS, 48 1% Low FPS
Acer Predator Helios NEO 16S AI | RTX 5080 115 W
Acer Nitro V16 | RTX 5070 95 W
Lenovo Legion 7i Pro Gen10 | RTX 5080 175 W
Lenovo Legion 9i Gen 10 | RTX 5080 175 W
Baldur’s Gate 3 (1080p Ultra) DataProductValueAcer Predator Helios NEO 16S AI | RTX 5080 115 W112 Avg FPS, 64 1% Low FPSAcer Nitro V16 | RTX 5070 95 W67 Avg FPS, 39 1% Low FPSLenovo Legion 7i Pro Gen10 | RTX 5080 175 W96 Avg FPS, 55 1% Low FPSLenovo Legion 9i Gen 10 | RTX 5080 175 W89 Avg FPS, 55 1% Low FPS
Acer Predator Helios NEO 16S AI | RTX 5080 115 W
Acer Nitro V16 | RTX 5070 95 W
Lenovo Legion 7i Pro Gen10 | RTX 5080 175 W
Lenovo Legion 9i Gen 10 | RTX 5080 175 W
Black Myth: Wukong benchmarking tool (1080p High) DataProductValueAcer Predator Helios NEO 16S AI | RTX 5080 115 W73 Avg FPS, 51 1% Low FPSAcer Nitro V16 | RTX 5070 95 W58 Avg FPS, 50 1% Low FPSLenovo Legion 7i Pro Gen10 | RTX 5080 175 W99 Avg FPS, 84 1% Low FPSLenovo Legion 9i Gen 10 | RTX 5080 175 W97 Avg FPS, 55 1% Low FPS
Acer Predator Helios NEO 16S AI | RTX 5080 115 W
Acer Nitro V16 | RTX 5070 95 W
Lenovo Legion 7i Pro Gen10 | RTX 5080 175 W
Lenovo Legion 9i Gen 10 | RTX 5080 175 W
F1 24 (1080p Ultra High) DataProductValueAcer Predator Helios NEO 16S AI | RTX 5080 115 W88 Avg FPS, 73 1% Low FPSAcer Nitro V16 | RTX 5070 95 W69 Avg FPS, 59 1% Low FPSLenovo Legion 7i Pro Gen10 | RTX 5080 175 W126 Avg FPS, 51 1% Low FPSLenovo Legion 9i Gen 10 | RTX 5080 175 W124 Avg FPS, 106 1% Low FPS
Acer Predator Helios NEO 16S AI | RTX 5080 115 W
Acer Nitro V16 | RTX 5070 95 W
Lenovo Legion 7i Pro Gen10 | RTX 5080 175 W
Lenovo Legion 9i Gen 10 | RTX 5080 175 W
Metro Exodus Enhanced Edition (1080p Ultra) DataProductValueAcer Predator Helios NEO 16S AI | RTX 5080 115 W98 Avg FPS, 37 1% Low FPSAcer Nitro V16 | RTX 5070 95 W74 Avg FPS, 27 1% Low FPSLenovo Legion 7i Pro Gen10 | RTX 5080 175 W140 Avg FPS, 72 1% Low FPSLenovo Legion 9i Gen 10 | RTX 5080 175 W133 Avg FPS, 71 1% Low FPS
Native gaming performance
Testing frame rates at the native resolution of each of the gaming laptops
Cyberpunk 2077 (Native res. RT Ultra)Baldur’s Gate 3 (Native res. Ultra)Black Myth: Wukong benchmarking tool (Native res. High)F1 24 (Native res. Ultra High)Metro Exodus Enhanced Edition (Native res. Ultra)
Acer Predator Helios NEO 16S AI | RTX 5080 115 W | 2560 x 1600
Acer Nitro V16 | RTX 5070 95 W | 2560 x 1600
Lenovo Legion 7i Pro Gen10 | RTX 5080 175 W | 2560 x 1600
Lenovo Legion 9i Gen 10 | RTX 5080 175 W | 3840 x 2400
Cyberpunk 2077 (Native res. RT Ultra) DataProductValueAcer Predator Helios NEO 16S AI | RTX 5080 115 W | 2560 x 160028 Avg FPS, 20 1% Low FPSAcer Nitro V16 | RTX 5070 95 W | 2560 x 160020 Avg FPS, 14 1% Low FPSLenovo Legion 7i Pro Gen10 | RTX 5080 175 W | 2560 x 160040 Avg FPS, 28 1% Low FPSLenovo Legion 9i Gen 10 | RTX 5080 175 W | 3840 x 240020 Avg FPS, 15 1% Low FPS
Acer Predator Helios NEO 16S AI | RTX 5080 115 W | 2560 x 1600
Acer Nitro V16 | RTX 5070 95 W | 2560 x 1600
Lenovo Legion 7i Pro Gen10 | RTX 5080 175 W | 2560 x 1600
Lenovo Legion 9i Gen 10 | RTX 5080 175 W | 3840 x 2400
Baldur’s Gate 3 (Native res. Ultra) DataProductValueAcer Predator Helios NEO 16S AI | RTX 5080 115 W | 2560 x 160076 Avg FPS, 35 1% Low FPSAcer Nitro V16 | RTX 5070 95 W | 2560 x 160059 Avg FPS, 31 1% Low FPSLenovo Legion 7i Pro Gen10 | RTX 5080 175 W | 2560 x 160096 Avg FPS, 42 1% Low FPSLenovo Legion 9i Gen 10 | RTX 5080 175 W | 3840 x 240073 Avg FPS, 53 1% Low FPS
Acer Predator Helios NEO 16S AI | RTX 5080 115 W | 2560 x 1600
Acer Nitro V16 | RTX 5070 95 W | 2560 x 1600
Lenovo Legion 7i Pro Gen10 | RTX 5080 175 W | 2560 x 1600
Lenovo Legion 9i Gen 10 | RTX 5080 175 W | 3840 x 2400
Black Myth: Wukong benchmarking tool (Native res. High) DataProductValueAcer Predator Helios NEO 16S AI | RTX 5080 115 W | 2560 x 160051 Avg FPS, 23 1% Low FPSAcer Nitro V16 | RTX 5070 95 W | 2560 x 160037 Avg FPS, 23 1% Low FPSLenovo Legion 7i Pro Gen10 | RTX 5080 175 W | 2560 x 1600111 Avg FPS, 80 1% Low FPSLenovo Legion 9i Gen 10 | RTX 5080 175 W | 3840 x 240069 Avg FPS, 57 1% Low FPS
Acer Predator Helios NEO 16S AI | RTX 5080 115 W | 2560 x 1600
Acer Nitro V16 | RTX 5070 95 W | 2560 x 1600
Lenovo Legion 7i Pro Gen10 | RTX 5080 175 W | 2560 x 1600
Lenovo Legion 9i Gen 10 | RTX 5080 175 W | 3840 x 2400
F1 24 (Native res. Ultra High) DataProductValueAcer Predator Helios NEO 16S AI | RTX 5080 115 W | 2560 x 160052 Avg FPS, 43 1% Low FPSAcer Nitro V16 | RTX 5070 95 W | 2560 x 160039 Avg FPS, 33 1% Low FPSLenovo Legion 7i Pro Gen10 | RTX 5080 175 W | 2560 x 160077 Avg FPS, 55 1% Low FPSLenovo Legion 9i Gen 10 | RTX 5080 175 W | 3840 x 240039 Avg FPS, 34 1% Low FPS
Acer Predator Helios NEO 16S AI | RTX 5080 115 W | 2560 x 1600
Acer Nitro V16 | RTX 5070 95 W | 2560 x 1600
Lenovo Legion 7i Pro Gen10 | RTX 5080 175 W | 2560 x 1600
Lenovo Legion 9i Gen 10 | RTX 5080 175 W | 3840 x 2400
Metro Exodus Enhanced Edition (Native res. Ultra) DataProductValueAcer Predator Helios NEO 16S AI | RTX 5080 115 W | 2560 x 160071 Avg FPS, 46 1% Low FPSAcer Nitro V16 | RTX 5070 95 W | 2560 x 160050 Avg FPS, 21 1% Low FPSLenovo Legion 7i Pro Gen10 | RTX 5080 175 W | 2560 x 160096 Avg FPS, 65 1% Low FPSLenovo Legion 9i Gen 10 | RTX 5080 175 W | 3840 x 240057 Avg FPS, 41 1% Low FPS
Synthetic gaming performance
Testing performance against industry standard benchmarks
3DMark Time Spy Extreme3DMark Port Royal3DMark Storage
Acer Predator Helios NEO 16S AI | RTX 5080 115 W | Core Ultra 9 290HX Plus
Acer Nitro V16 | RTX 5070 95 W | Ryzen 7 260
Lenovo Legion 7i Pro Gen10 | RTX 5080 175 W | Core Ultra 9 275HX
Lenovo Legion 9i Gen 10 | RTX 5080 175 W | Core Ultra 9 275HX
3DMark Time Spy Extreme DataProductValueAcer Predator Helios NEO 16S AI | RTX 5080 115 W | Core Ultra 9 290HX Plus7785 Overall index score, 6897 GPU index, 7966 CPU indexAcer Nitro V16 | RTX 5070 95 W | Ryzen 7 2605780 Overall index score, 5790 GPU index, 5726 CPU indexLenovo Legion 7i Pro Gen10 | RTX 5080 175 W | Core Ultra 9 275HX11318 Overall index score, 11138 GPU index, 12459 CPU indexLenovo Legion 9i Gen 10 | RTX 5080 175 W | Core Ultra 9 275HX12746 Overall index score, 11026 GPU index, 11253 CPU index
Acer Predator Helios NEO 16S AI | RTX 5080 115 W | Core Ultra 9 290HX Plus
Acer Nitro V16 | RTX 5070 95 W | Ryzen 7 260
Lenovo Legion 7i Pro Gen10 | RTX 5080 175 W | Core Ultra 9 275HX
Lenovo Legion 9i Gen 10 | RTX 5080 175 W | Core Ultra 9 275HX
3DMark Port Royal DataProductValueAcer Predator Helios NEO 16S AI | RTX 5080 115 W | Core Ultra 9 290HX Plus10846Acer Nitro V16 | RTX 5070 95 W | Ryzen 7 2604447Lenovo Legion 7i Pro Gen10 | RTX 5080 175 W | Core Ultra 9 275HX14870Lenovo Legion 9i Gen 10 | RTX 5080 175 W | Core Ultra 9 275HX14355
Acer Predator Helios NEO 16S AI | RTX 5080 115 W | Core Ultra 9 290HX Plus
Acer Nitro V16 | RTX 5070 95 W | Ryzen 7 260
Lenovo Legion 7i Pro Gen10 | RTX 5080 175 W | Core Ultra 9 275HX
Lenovo Legion 9i Gen 10 | RTX 5080 175 W | Core Ultra 9 275HX
3DMark Storage DataProductValueAcer Predator Helios NEO 16S AI | RTX 5080 115 W | Core Ultra 9 290HX Plus981 Overall index score, 159.74 Avg bandwidth (MB/s), 174 Access time (ųs)Acer Nitro V16 | RTX 5070 95 W | Ryzen 7 2602054 Overall index score, 354.22 Avg bandwidth (MB/s), 88 Access time (ųs)Lenovo Legion 7i Pro Gen10 | RTX 5080 175 W | Core Ultra 9 275HX2153 Overall index score, 366.92 Avg bandwidth (MB/s), 83 Access time (ųs)Lenovo Legion 9i Gen 10 | RTX 5080 175 W | Core Ultra 9 275HX2336 Overall index score, 395.56 Avg bandwidth (MB/s), 76 Access time (ųs)
Now I’ll let the charts do the talking predominantly for the rest of the figures, but the key numbers I want to focus on are how the Helios handles Metro Exodus at 1080p, because it’s really telling on a number of fronts.
So during that benchmark run, we measure average and max temps for the CPU and the graphics card, alongside GPU clock speed and power draw. We measure all through those runs, which last for about 10 minutes or so. Reason being is that it’s a really good simultaneous load test for both the CPU and the GPU in a gaming environment, particularly at a lower res, as it stresses the CPU more than it would at 1440p or 4K.
Average power draw for the RTX 5080 in that result was 66W. It’s got 115W to play with, remember, which means the load for the card is sitting about 49W lower than it potentially could be if it was running at full tilt. Similarly, the CPU maxed out at 105 degrees Celsius and averaged 77 Celsius across the runs, which isn’t super hot on the average. Now, the chip is Intel’s latest “refreshed” (I use that term lightly), Arrow Lake, 24-core. It’s hot, it’s hungry, it’s stable at high temps, and did I mention it’s well hot?
System performance
Testing the power and thermal performance of the laptop across three 1080p runs of Metro Exodus: Enhanced
GPU statsGaming temperaturesSystem temperatures
Acer Predator Helios NEO 16S AI | RTX 5080 115 W
Acer Nitro V16 | RTX 5070 95 W
Lenovo Legion 7i Pro Gen10 | RTX 5080 175 W
Lenovo Legion 9i Gen 10 | RTX 5080 175 W
GPU stats DataProductValueAcer Predator Helios NEO 16S AI | RTX 5080 115 W1573 Avg GPU freq. (MHz), 66 Avg GPU power (W)Acer Nitro V16 | RTX 5070 95 W2217 Avg GPU freq. (MHz), 75 Avg GPU power (W)Lenovo Legion 7i Pro Gen10 | RTX 5080 175 W2375 Avg GPU freq. (MHz), 127 Avg GPU power (W)Lenovo Legion 9i Gen 10 | RTX 5080 175 W2480 Avg GPU freq. (MHz), 132 Avg GPU power (W)
Acer Predator Helios NEO 16S AI | RTX 5080 115 W
Acer Nitro V16 | RTX 5070 95 W
Lenovo Legion 7i Pro Gen10 | RTX 5080 175 W
Lenovo Legion 9i Gen 10 | RTX 5080 175 W
Gaming temperatures DataProductValueAcer Predator Helios NEO 16S AI | RTX 5080 115 W77 Avg CPU (°C), 105 Max CPU (°C), 72 Avg GPU (°C), 75 Max GPU (°C)Acer Nitro V16 | RTX 5070 95 W69 Avg CPU (°C), 81 Max CPU (°C), 74 Avg GPU (°C), 79 Max GPU (°C)Lenovo Legion 7i Pro Gen10 | RTX 5080 175 W94 Avg CPU (°C), 105 Max CPU (°C), 74 Avg GPU (°C), 79 Max GPU (°C)Lenovo Legion 9i Gen 10 | RTX 5080 175 W87 Avg CPU (°C), 105 Max CPU (°C), 75 Avg GPU (°C), 80 Max GPU (°C)
Acer Predator Helios NEO 16S AI | RTX 5080 115 W
Acer Nitro V16 | RTX 5070 95 W
Lenovo Legion 7i Pro Gen10 | RTX 5080 175 W
Lenovo Legion 9i Gen 10 | RTX 5080 175 W
System temperatures DataProductValueAcer Predator Helios NEO 16S AI | RTX 5080 115 W106 Max CPU temp (°C), 76 Max GPU temp (°C)Acer Nitro V16 | RTX 5070 95 W92 Max CPU temp (°C), 75 Max GPU temp (°C)Lenovo Legion 7i Pro Gen10 | RTX 5080 175 W104 Max CPU temp (°C), 69 Max GPU temp (°C)Lenovo Legion 9i Gen 10 | RTX 5080 175 W106 Max CPU temp (°C), 69 Max GPU temp (°C)
Compared to the Lenovo Legion 9i Gen 10, which is similarly equipped (RTX 5080 175W, Intel Core Ultra 9 275HX, much RAM, SSDs, etc), the results are dramatic, even across its two profiles. There’s a 35 fps difference between the two at 1080p (with both laptops in gaming mode), the clock speeds are a whole 1 GHz apart on the GPU, power draw is exactly double; and interestingly, the CPU maxes out at a similar 105 degrees, but averages 10 degrees more at 87 °C over the duration of the test.
On paper, for the Neo, it logically sounds predictable, right? Clearly it’s throttling at 1080p, that then chokes out the graphics card, which can’t draw system resources to generate the frames, and so you get a 35 fps deficit, high temps on the CPU, and low temps and clock speeds on the GPU as a result. But that only tells half the story. Because if that is the case, then why is the average CPU temp 10 degrees lower than its Legion counterpart?
And here’s the thing: we shouldn’t assume that identical or similar temperature readings across these two CPUs, in these two configurations, represent identical or similar clock speeds or, more importantly, performance, for that matter. The 9i in its gaming profile, maxing at 105 °C and averaging 87 °C, isn’t the same as the Neo doing 105 °C and 77 °C. In fact, I believe (I can’t test this as we no longer have the Legion), it’s actually an issue with the cooling.
FutureFutureFutureFuture
Because the thermal management system in the Lenovo Legion 9i is larger because of its chassis size, although the chip is hitting similar temps, it may well be that it can sustain higher clock speeds for longer without necessarily hitting thermal limits on the cooling setup. Lenovo’s cooling solution can likely handle a larger volume of heat (these cooling solutions are shared between both the CPU and GPU), whereas the Predator Helios Neo can handle significantly less before it thermally overloads, which then forces the Neo to drop the clock speed of its CPU down to avoid thermal runaway and keep the system stable, which in turn throttles performance across the graphics card, dropping the CPU temperature, GPU power draw and clock speed simultaneously. The chips are still thermally throttling technically, but it’s because of the cooling capacity reaching its ceiling, not because of the chips themselves.
Basically, because the Predator Helios Neo has such a small footprint and is so slim, and Acer’s crammed that 92 WHr battery in there, it can’t accommodate the cooling to let the chips run at the speeds that they’re capable of, so it slows them down to prevent any overly aggressive damage affecting the silicon long-term. Which is why, even in advance of that, that power ceiling for the RTX 5080 is stuck at a lowly 115W, and yet even despite that, it struggles in titles where the CPU can let loose.
What I do find ironic, and more telling, is that Lenovo’s “quiet” profile is actually quite similar to Acer’s “gaming” mode. With nearly identical GPU power and similar(ish) clock speeds, albeit with considerably lower CPU temperatures.
Battery life
Using PCMark 10’s Gaming battery life test to measure how long the system runs a looping 3DMark Firestrike test
PCMark 10
Acer Predator Helios NEO 16S AI | 92 Wh
Lenovo Legion 7i Pro Gen10 | 99.9 Wh
Lenovo Legion 9i Gen 10 | 99.9 Wh
037.575112.5150
Battery life (minutes)
PCMark 10 DataProductValueAcer Predator Helios NEO 16S AI | 92 Wh53Acer Nitro V16 | 76 Wh140Lenovo Legion 7i Pro Gen10 | 99.9 Wh73Lenovo Legion 9i Gen 10 | 99.9 Wh57
What’s worse is that I can’t tell if this was a good design trade-off or not, because in our battery life test, it only lasted 53 minutes. One of the lowest results I’ve seen for what feels like an eternity. There’s a good argument to be had here that you should probably skip the RTX 5080 version entirely and opt for the lower-spec 5070 Ti variant instead. You’ll get a longer battery life, more accessible performance, and a cooler laptop at a cheaper price tag; and still one that comes with that beautiful screen, design, and port setup.
Creator performance
Measuring the CPU and GPU’s compute power for creative tasks, such as rendering
Cinebench 2024Blender 4.2.0 (junkshop)7zip 24.07Procyon
Acer Predator Helios NEO 16S AI | Core Ultra 9 290HX Plus
Acer Nitro V16 | Ryzen 7 260
Lenovo Legion 7i Pro Gen10 | Core Ultra 9 275HX
Lenovo Legion 9i Gen 10 | Core Ultra 9 275HX
Cinebench 2024 DataProductValueAcer Predator Helios NEO 16S AI | Core Ultra 9 290HX Plus1705 Multi-core index score, 135 Single-core index scoreAcer Nitro V16 | Ryzen 7 260887 Multi-core index score, 103 Single-core index scoreLenovo Legion 7i Pro Gen10 | Core Ultra 9 275HX2039 Multi-core index score, 138 Single-core index scoreLenovo Legion 9i Gen 10 | Core Ultra 9 275HX2122 Multi-core index score, 132 Single-core index score
Acer Predator Helios NEO 16S AI | Core Ultra 9 290HX Plus
Acer Nitro V16 | Ryzen 7 260
Lenovo Legion 7i Pro Gen10 | Core Ultra 9 275HX
Lenovo Legion 9i Gen 10 | Core Ultra 9 275HX
Blender 4.2.0 (junkshop) DataProductValueAcer Predator Helios NEO 16S AI | Core Ultra 9 290HX Plus126.27 CPU (samples/min), 1544.91 GPU (samples/min)Acer Nitro V16 | Ryzen 7 26070.02 CPU (samples/min), 1031.76 GPU (samples/min)Lenovo Legion 7i Pro Gen10 | Core Ultra 9 275HX156.29 CPU (samples/min), 1883.93 GPU (samples/min)Lenovo Legion 9i Gen 10 | Core Ultra 9 275HX154.39 CPU (samples/min), 1878.55 GPU (samples/min)
Acer Predator Helios NEO 16S AI | Core Ultra 9 290HX Plus
Acer Nitro V16 | Ryzen 7 260
Lenovo Legion 7i Pro Gen10 | Core Ultra 9 275HX
Lenovo Legion 9i Gen 10 | Core Ultra 9 275HX
7zip 24.07 DataProductValueAcer Predator Helios NEO 16S AI | Core Ultra 9 290HX Plus137.882 Compressing (GIPS), 135.169 Decompressing (GIPS)Acer Nitro V16 | Ryzen 7 26092.12 Compressing (GIPS), 115.02 Decompressing (GIPS)Lenovo Legion 7i Pro Gen10 | Core Ultra 9 275HX162.454 Compressing (GIPS), 184.259 Decompressing (GIPS)Lenovo Legion 9i Gen 10 | Core Ultra 9 275HX131.92 Compressing (GIPS), 182.47 Decompressing (GIPS)
Acer Predator Helios NEO 16S AI | Core Ultra 9 290HX Plus
Acer Nitro V16 | Ryzen 7 260
Lenovo Legion 7i Pro Gen10 | Core Ultra 9 275HX
Lenovo Legion 9i Gen 10 | Core Ultra 9 275HX
Procyon DataProductValueAcer Predator Helios NEO 16S AI | Core Ultra 9 290HX Plus2256 Overall index score, 44.32 Duration (Sec), 2.77 Sec/imageAcer Nitro V16 | Ryzen 7 2601608 Overall index score, 62.16 Duration (Sec), 3.89 Sec/imageLenovo Legion 7i Pro Gen10 | Core Ultra 9 275HX2853 Overall index score, 35.05 Duration (Sec), 2.19 Sec/imageLenovo Legion 9i Gen 10 | Core Ultra 9 275HX3029 Overall index score, 33.01 Duration (Sec), 2.06 Sec/image
Quickly wrapping up the rest of the specs, as I’m very aware I’ve spent half this review writing a small dissertation on product design considerations and thermal envelopes, CPU performance was genuinely astonishing. The results were outstanding in Cinebench, particularly on the single-core, which scored a huge 135 points. Multi-core flagged a touch at 1,705 points, but again, I’d chalk that up to the cooling being the limiting factor, not the chip itself. Oh, and the twin 1 TB Kingston SSDs in this thing are incredibly slow, with some of the worst results I’ve seen in 3DMark’s storage test this generation. No doubt a sign of the NAND end-times.
I think I complain about this in almost every laptop review, but I’m so tired of the current ecosystem being the way it is. Whether that’s single vs dual-channel RAM configs continually being spirited away disguised as “oh, it’s user choice”, or different laptop GPUs coming in at different wattages and performing vastly different to one another. It’s just so frustrating to navigate as someone who’s looking to buy one, and the sad fact is, the Helios Neo is incredible; everything about it, from an exterior perspective, hell, even down to the sticker, makes it look like one of the best gaming laptops money can buy. And yet, open up a simple 1080p test, and it simply falls over. All because form came before function. And that’s it. A cascade of minor decisions leading to a bigger impact than you could’ve predicted.