Microsoft has just shared an update to DirectX, labelling it “the biggest wave of new tooling features in DirectX’s history.” The company, alongside major “GPU hardware partners”, has shared its “dream of bringing console-level GPU developer tools to Windows.”
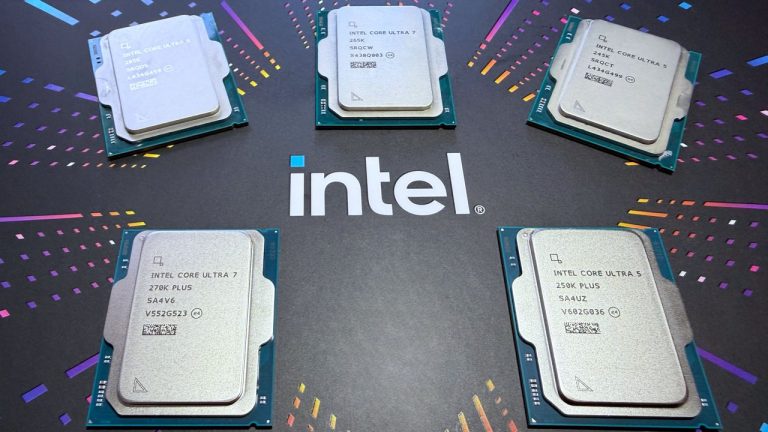
Microsoft reports, “AMD, Intel, Nvidia, and Qualcomm have worked closely with us throughout feature development, each making significant contributions to make this release possible.”
The new changes come in a few different sections. The first is the introduction of DirectX dump files. As elaborated on in the Microsoft Game Dev blog, “GPU-related bugs can emerge at any point in a game’s lifecycle, and developers have sought more thorough crash-dump infrastructure to understand their causes.”
These dump files can help with both retail users and developer machines, giving a better understanding of what has gone wrong and why. Dump files will reportedly give logs on the hardware and driver state, plus the state of DirectX, and what was happening in the game before the dump file was created. Giving more information in condensed forms like this can help with all kinds of troubleshooting.
Another big update to DirectX is the introduction of “Live Shader Debugging”. Effectively, this would allow for real-time shader debugging, which is a celebrated feature on Xbox already. It is currently planned for release in 2027. Microsoft claims it is designed for “needle in the haystack” style problems and also reports it’s “the deepest GPU tooling collaboration with hardware vendors in Windows history.”
(Image credit: Future)
This debugging on PC was only shown off as a preview at this year’s GDC, but Microsoft says the public can expect more details in the coming months.
Microsoft has also noted its new shader explorer, which it claims is “a new way to inspect, understand and debug compiled shaders, with deeper live analysis”.
This new explorer works with Pix, Windows’ debugging tool, and Microsoft has shown off a version working on both AMD and Intel hardware. Interestingly, the shader explorer is not paired to the driver, so developers can analyse shaders for GPUs they don’t own. This could potentially help with optimising for the myriad hardware forms that make up PC gaming, especially in smaller dev teams with less access to different hardware.
Microsoft points out specific integrations that AMD and Intel have implemented for these new bits of tech, but it points out that “all four have invested in PIX plugin support to surface their hardware-specific information through PIX’s standardized UI.”
Given Microsoft’s push towards PC gaming with its hybrid next-generation console, Project Helix, there’s a good argument for why Microsoft might want to enable console-like dev tools for Windows devices. Project Helix is losing part of its traditional console appeal with its PC gaming capabilities, so giving developers tools to fine-tune and more easily report problems could help with long-term optimisation.